Appendix B: Using an IDE
There are several Python IDEs (Integrated Development Environments) that you can use to manage a Python programming project.
If you have not done so already, install Python in your Computer.
The standard Python installation comes with a basic IDE called IDLE. It can be used to write, run, and debug Python code.
PyCharm is a more sophisticated IDE that is widely used. PyCharm has a free community edition. The professional edition too is free for students.
PyCharm's own documentation on setting up your first project in PyCharm is given here.
Exercise: Setup a Project in PyCharm
Exercise : Setup a Project in PyCharm
- Install Python and PyCharm if you haven't done so already.
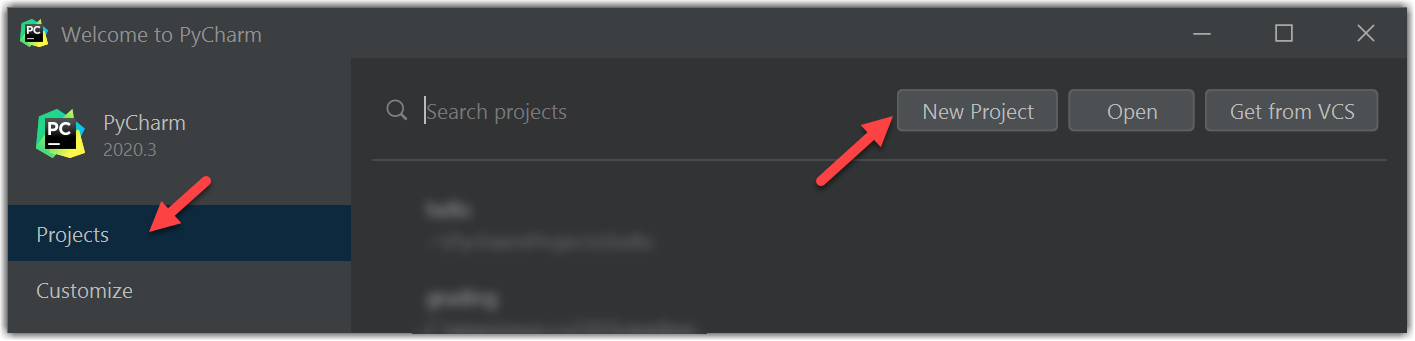
- Start PyCharm and click on the
Create New Projectoption.
- In the next screen, specify that as the project location.
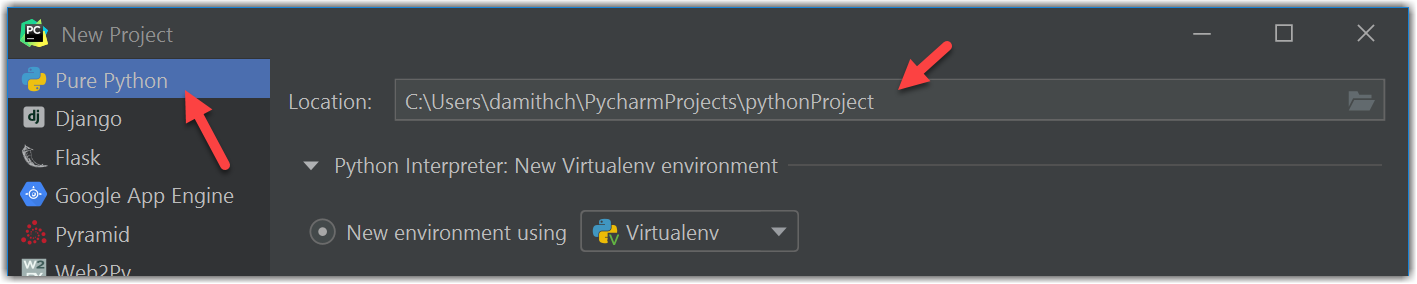
- You can accept defaults for the remaining steps.
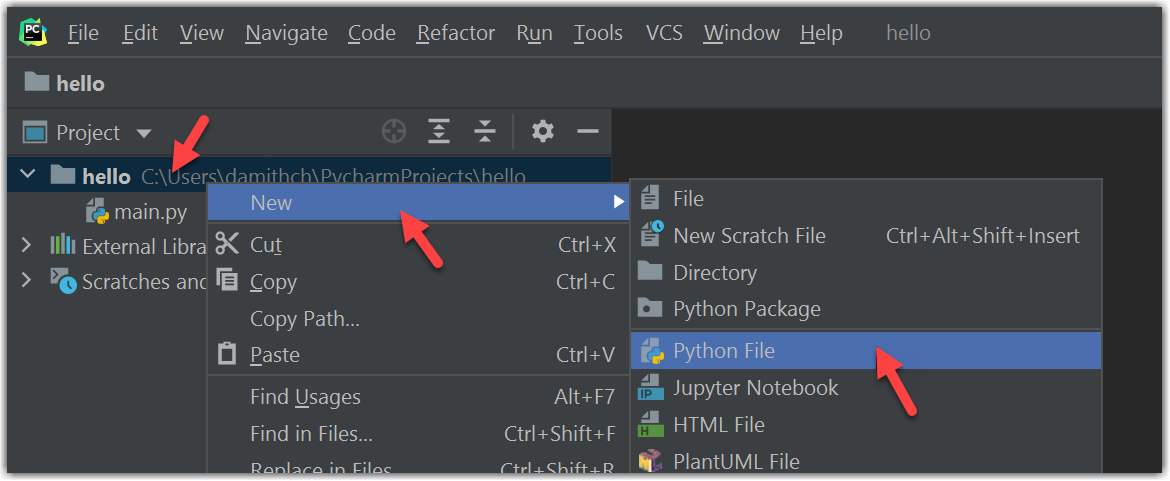
- To add a new file, right-click on project name and choose
New→Python File. Provide a file name in the next screen. E.g.,greet.py
- Type your code in the file.
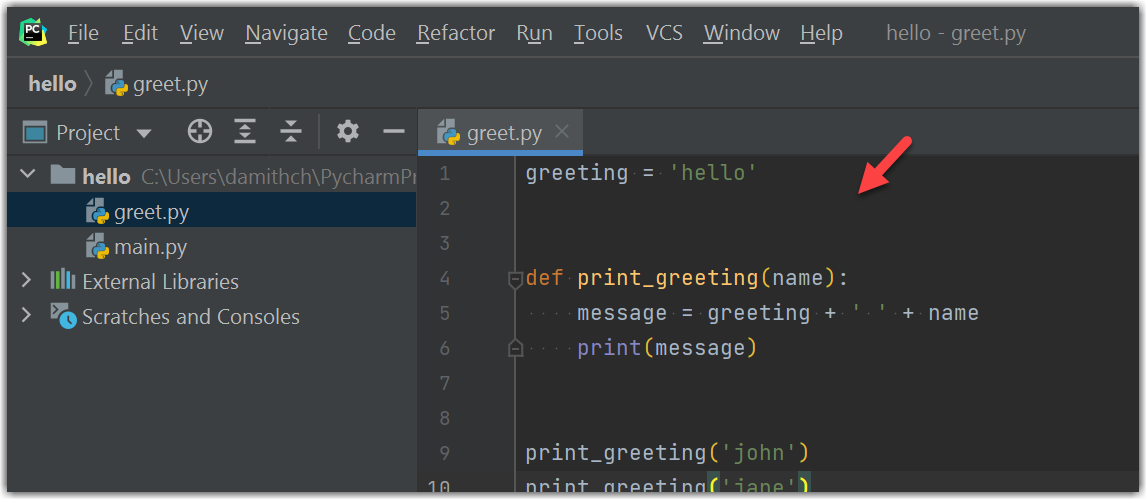
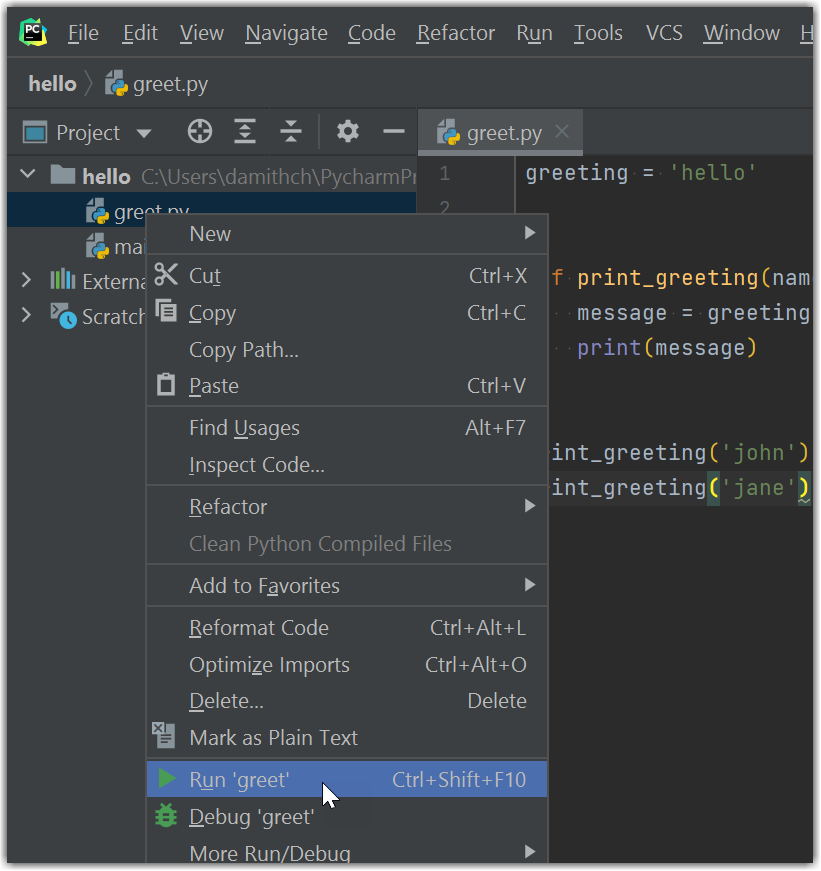
Here is an example:greeting = 'hello' def print_greeting(name): message = greeting + ' ' + name print(message) print_greeting('john') print_greeting('jane') - To run the code, Right-click on project name and choose
Run 'filename'.
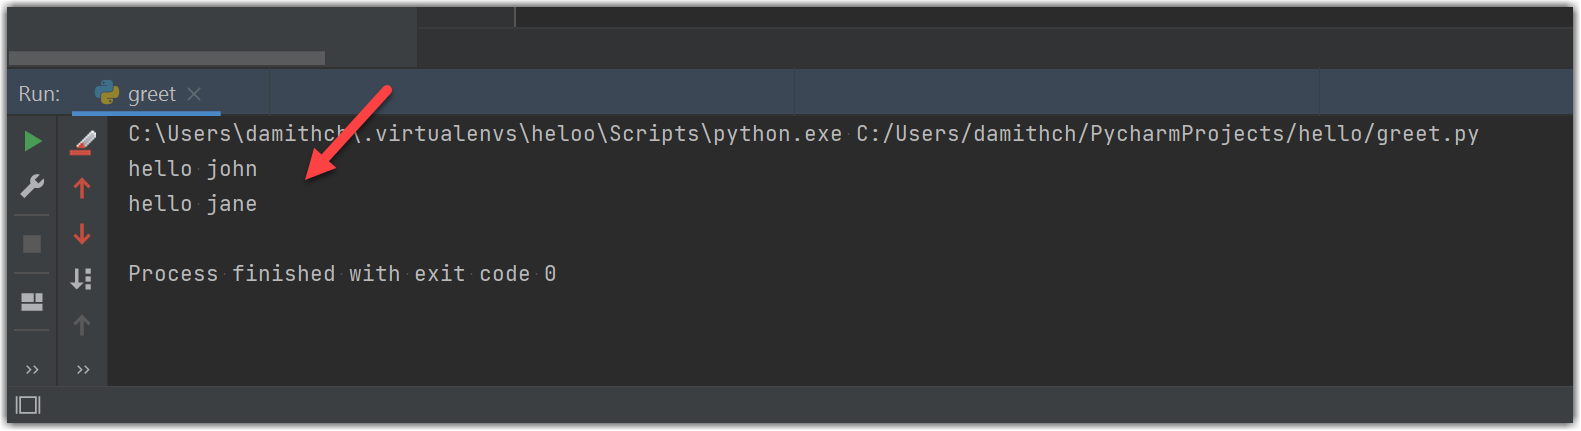
- The output will appear in the panel at the bottom of the IDE.
PyCharm's own documentation on debugging code in PyCharm is given here.
Exercise: Debug a Project in PyCharm
Exercise : Debug a Project in PyCharm
- Open a project in PyCharm. Go to a project file containing Python code.
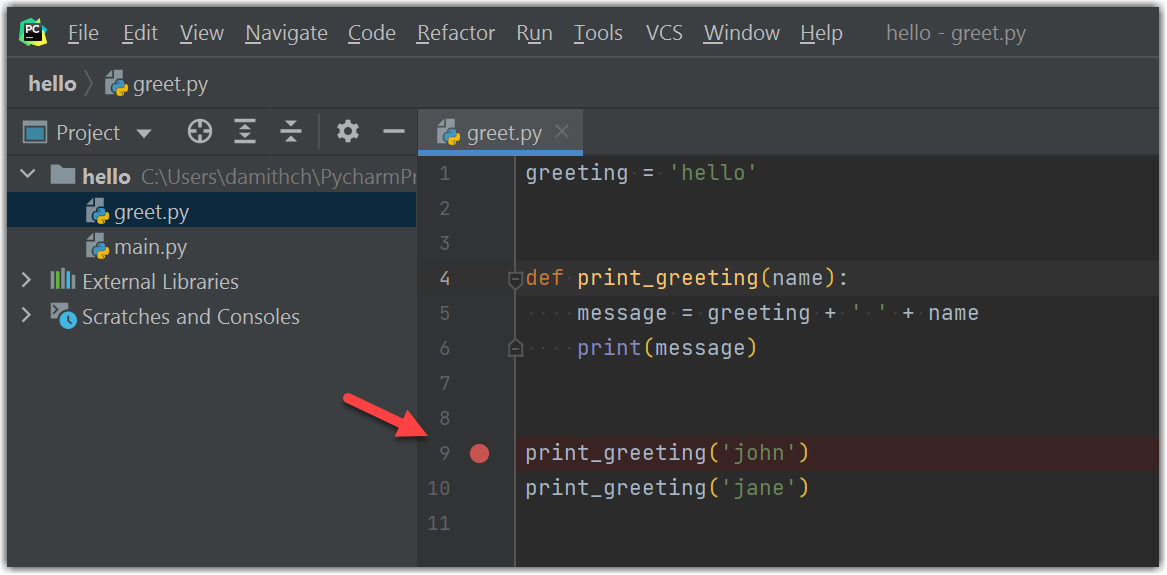
- To create a breakpoint at a statement, click on the next to the line. A red dot should appear to indicate that the breakpoint has been set. You can remove the breakpoint by clicking on the red dot again.
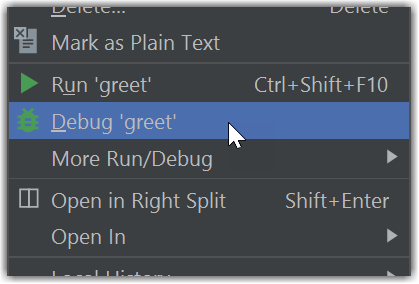
- To start debugging, choose
Debuginstead ofRun.
- The execution will pause at the first breakpoint. Use the debugging buttons to step through the code. You can see the , choose
Debuginstead ofRun. You can see the value of the variables in the debugger Window, in the area below the debugging buttons.
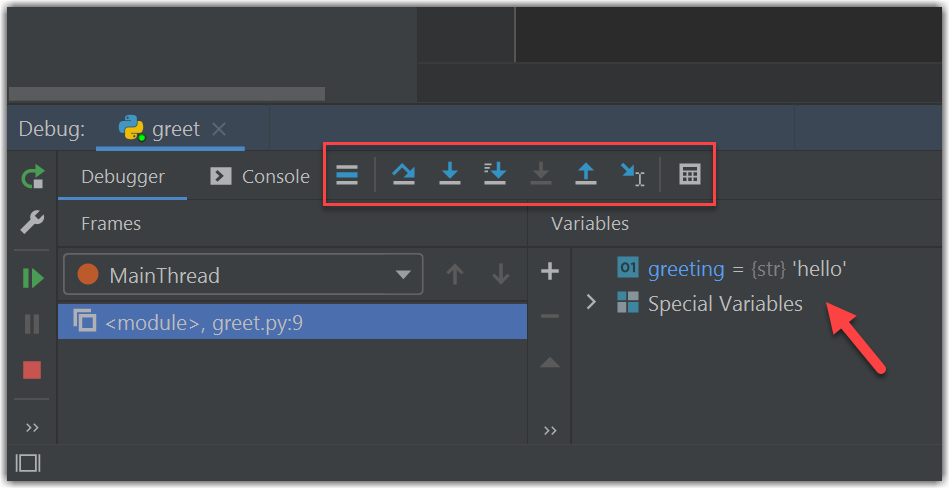
Useful buttons:
Step over: executes the statement and moves to the next statementStep in: goes into the function that is called in the current statement.Step out: finish executing the current function and goes back to the code that called the function.